San Diego County Housing Report: Housing Insanity Returns April 17, 2023
With the number of available homes to purchase at extremely low levels, there simply are too many buyers competing against each other despite high mortgage rates.
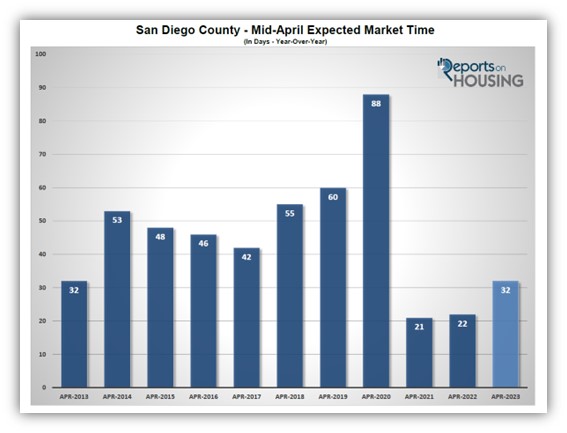
A Seller’s Market - When the Expected Market Time drops below 40 days, the housing market leans heavily in favor of sellers.
Home much equity has your home gained in 2023?
A three-bedroom, two-and-a-half bathroom, 2,100 square foot home on a 3,700 square foot lot, built in 2003, was placed on the market on the second Tuesday of March at $1,099,000. There was a steady stream of buyers during a three-hour window on Saturday and a two-hour window on Sunday. By Monday evening, more than 20 offers were submitted to the listing agent. The seller countered all offers and asked them to return with their highest and best price. The home closed during the second week of April at $1,145,000, an astonishing 4% above its list price.

Not every home sells above the asking price, especially in today’s high mortgage rate environment. The sales-to-list price ratio for detached homes priced below $1.5 million so far in April is 100.4%. For luxury homes, anything priced above $1.5 million (the top 10% of closings), it drops to 98%. The median time on the market is nine days, a little over a week. It would probably be even faster, but there are too many offers for many sellers to sift through.
The Expected Market Time, the time between coming on the market and opening escrow, is a function of supply, the number of available homes, and demand, a snapshot of recent pending sales activity. Typically, the inventory slowly grows from January through March and then picks up steam during the spring. Click here to view the full report
This year, the inventory dropped from 2,898 in January to 2,067 today, plunging by 29%. The 3-year average mid-April inventory before COVID (2017 to 2019) was 6,010, an unbelievable 191% higher than today, nearly triple. Demand has increased from 1,144 pending sales to 1,912 today, a 67% rise. The 3-year pre-COVID average was 3,466, 81% higher than today, its lowest level for mid-April since 2020, during the initial pandemic lockdowns. Demand readings are down because of higher rates and fewer homes available to place into escrow.
With the number of available homes to purchase at extremely low levels, there simply are too many buyers competing against each other despite high mortgage rates.
A Seller’s Market - When the Expected Market Time drops below 40 days, the housing market leans heavily in favor of sellers.
Home much equity has your home gained in 2023?
A three-bedroom, two-and-a-half bathroom, 2,100 square foot home on a 3,700 square foot lot, built in 2003, was placed on the market on the second Tuesday of March at $1,099,000. There was a steady stream of buyers during a three-hour window on Saturday and a two-hour window on Sunday. By Monday evening, more than 20 offers were submitted to the listing agent. The seller countered all offers and asked them to return with their highest and best price. The home closed during the second week of April at $1,145,000, an astonishing 4% above its list price.

Not every home sells above the asking price, especially in today’s high mortgage rate environment. The sales-to-list price ratio for detached homes priced below $1.5 million so far in April is 100.4%. For luxury homes, anything priced above $1.5 million (the top 10% of closings), it drops to 98%. The median time on the market is nine days, a little over a week. It would probably be even faster, but there are too many offers for many sellers to sift through.
The Expected Market Time, the time between coming on the market and opening escrow, is a function of supply, the number of available homes, and demand, a snapshot of recent pending sales activity. Typically, the inventory slowly grows from January through March and then picks up steam during the spring. Click here to view the full report
This year, the inventory dropped from 2,898 in January to 2,067 today, plunging by 29%. The 3-year average mid-April inventory before COVID (2017 to 2019) was 6,010, an unbelievable 191% higher than today, nearly triple. Demand has increased from 1,144 pending sales to 1,912 today, a 67% rise. The 3-year pre-COVID average was 3,466, 81% higher than today, its lowest level for mid-April since 2020, during the initial pandemic lockdowns. Demand readings are down because of higher rates and fewer homes available to place into escrow.
Categories:
George Lorimers Real Estate Newsletter
We would like to hear from you! If you have any questions, please do not hesitate to contact us. We are always looking forward to hearing from you! We will do our best to reply to you within 24 hours !

