San Diego County Housing Summary
Are you thinking about selling or buying a home? Call/text George Lorimer at 619-846-1244.
Are you thinking about selling or buying a home? Call/text George Lorimer at 619-846-1244.
- The active listing inventory increased by 19 homes, nearly unchanged, in the past couple of weeks and now stands at 4,771. In September, 30% fewer homes came on the market compared to the 3-year average before COVID (2017 to 2019), 1,278 fewer. Yet, 545 more sellers came on the market this September compared to September 2023. Last year, there were 2,749 homes on the market, 2,022 fewer homes, or 42% less. The 3-year average before COVID (2017 to 2019) was 7,009, or 47% extra, much higher.
Find out what homes in your neighborhood are selling for
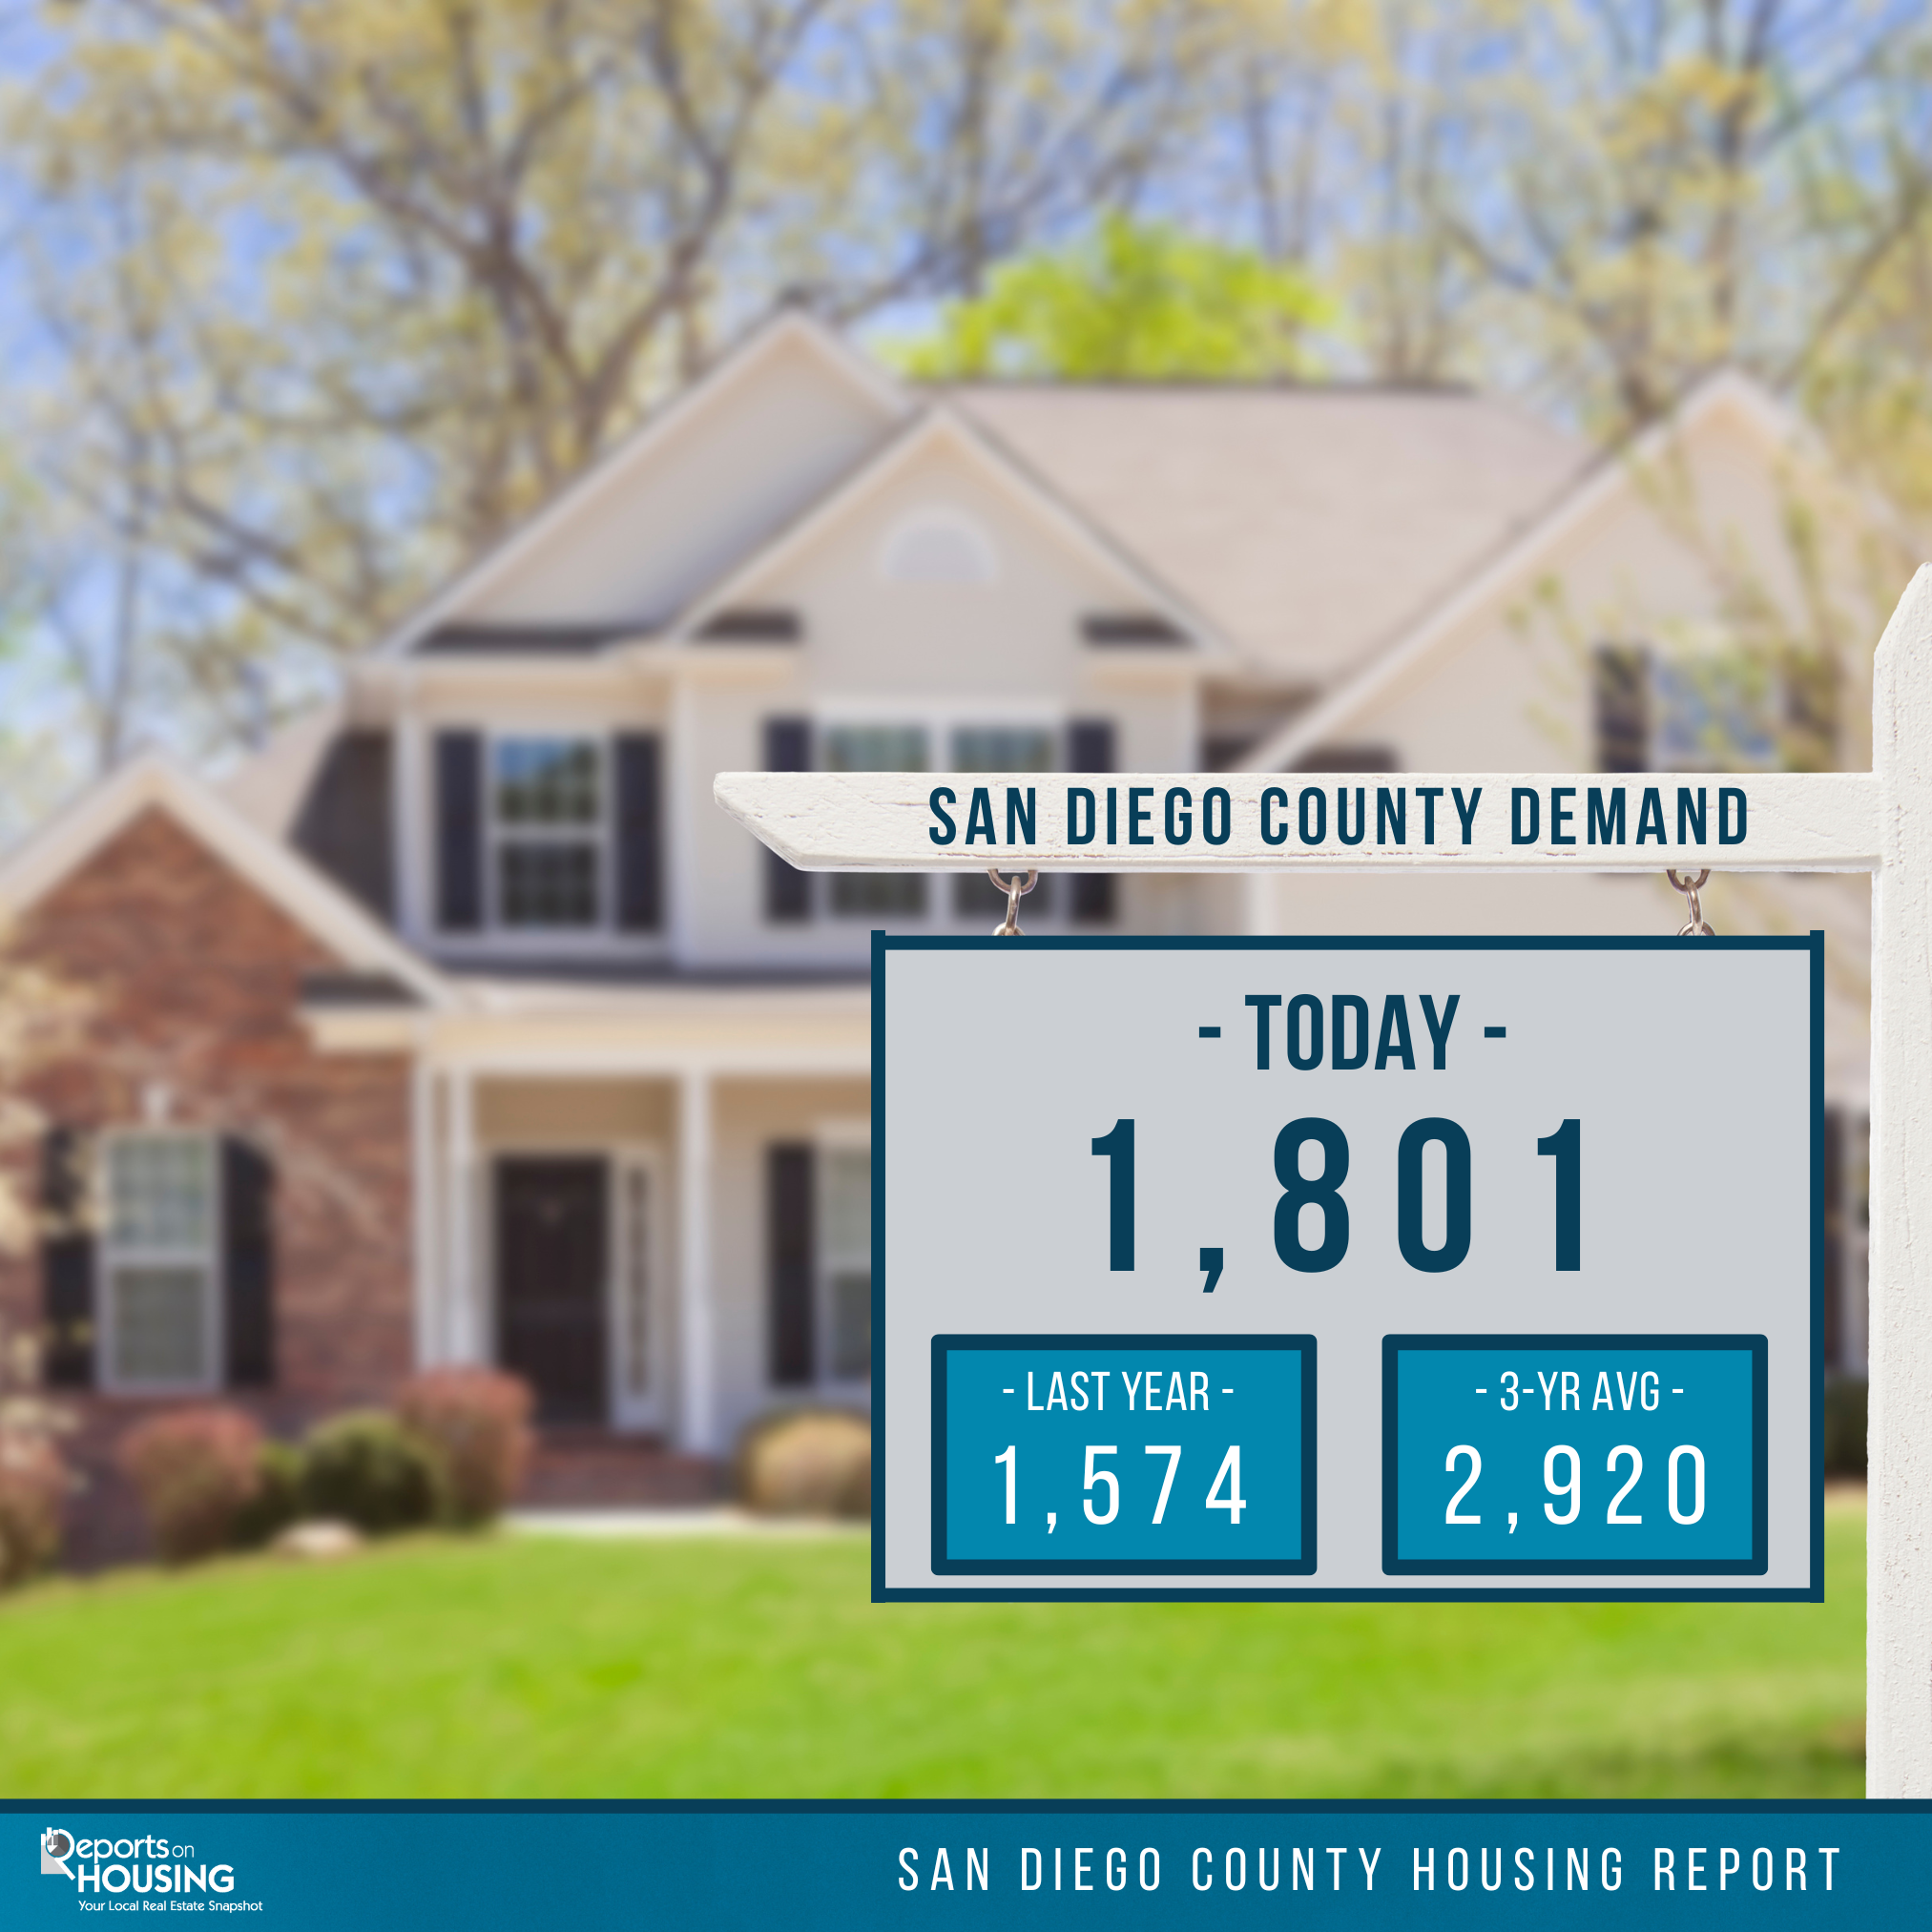
- Demand, the number of pending sales over the prior month, increased by 110 pending sales in the past two weeks, up 7%, and now totals 1,801, its largest increase since February. Last year, there were 1,574 pending sales, 227 fewer or 13% less. The 3-year average before COVID (2017 to 2019) was 2,920, or 62% more.
- With demand surging and supply nearly unchanged, the Expected Market Time (the number of days it takes to sell all San Diego County listings at the current buying pace) decreased from 84 to 79 days in the past couple of weeks. Last year, it was 52 days, much faster than today. The 3-year average before COVID was 73 days, slightly faster than today.
- In the past two weeks, the Expected Market Time for homes priced below $750,000 decreased from 75 to 72 days. This range represents 30% of the active inventory and 33% of demand.
See what's new on the market
- The Expected Market Time for homes priced between $750,000 and $1 million decreased from 67 to 64 days. This range represents 23% of the active inventory and 28% of demand.
- The Expected Market Time for homes priced between $1 million and $1.25 million decreased from 87 to 70 days. This range represents 11% of the active inventory and 13% of demand.
- The Expected Market Time for homes priced between $1.25 million and $1.5 million increased from 83 to 90 days. This range represents 9% of the active inventory and 8% of demand.
- The Expected Market Time for homes priced between $1.5 million and $2 million increased from 87 to 88 days. This range represents 9% of the active inventory and 8% of demand.
- In the past two weeks, the Expected Market Time for homes priced between $2 million and $4 million decreased from 141 to 126 days. The Expected Market Time for homes priced between $4 million and $6 million decreased from 210 to 130 days. The Expected Market Time for homes priced above $6 million increased from 375 to 383 days.
- The luxury end, all homes above $2 million, account for 18% of the inventory and 10% of demand.
- Distressed homes, both short sales and foreclosures combined, comprised only 0.4% of all listings and 0.3% of demand. Only 11 foreclosures and nine short sales are available today in San Diego County, with 20 total distressed homes on the active market, up two from two weeks ago. Last year, 10 distressed homes were on the market, similar to today.
- There were 2,167 closed residential resales in August, up 1% from August 2023’s 2,149 closed sales. August marked a 2% decrease compared to July 2024. The sales-to-list price ratio was 99.1% for all of San Diego County. Foreclosures accounted for only 0.1% of all closed sales, and short sales accounted for 0.1% of all closed sales. That means that 99.8% of all sales were good ol’ fashioned sellers with equity.
Report on housing- Steven Thomas - For more stats charts for free, email GeorgeLorimersd@gmail.com
We would like to hear from you! If you have any questions, please do not hesitate to contact us. We are always looking forward to hearing from you! We will do our best to reply to you within 24 hours !

